Issue analytics
DETAILS: Tier: Premium, Ultimate Offering: GitLab.com, Self-managed, GitLab Dedicated
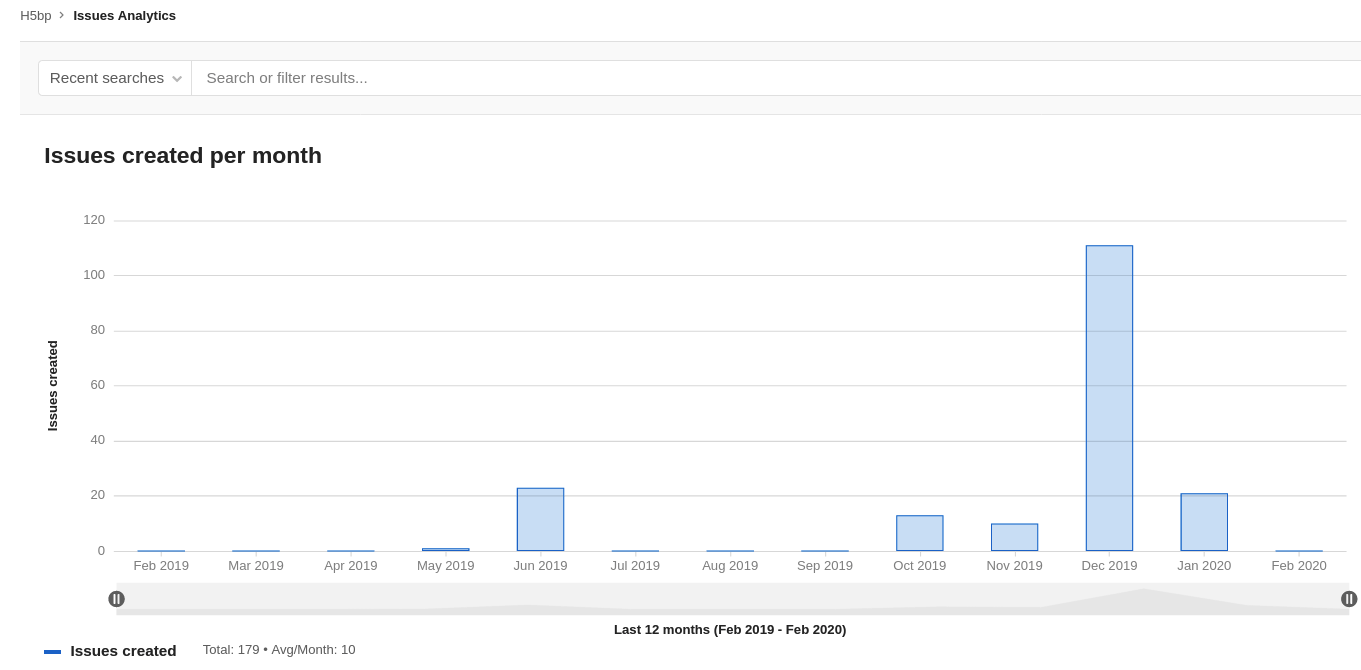
Issue analytics is a bar graph which illustrates the number of issues created each month. The default time span is 13 months, which includes the current month, and the 12 months prior. Issue analytics is available for projects and groups.
To access the chart:
- On the left sidebar, select Search or go to and find your project or group.
- Select Analyze > Issue analytics.
You can also access the chart from the Value Streams Dashboard through the New issues drill-down report.
Hover over each bar to see the total number of issues.
To narrow the scope of issues included in the graph, enter your criteria in the Search or filter results text box. Criteria from the following list can be typed in or selected from a menu:
- Author
- Assignee
- Milestone
- Label
- My reaction
- Weight
You can change the total number of months displayed by setting a URL parameter.
For example, https://gitlab.com/groups/gitlab-org/-/issues_analytics?months_back=15
shows a total of 15 months for the chart in the GitLab.org group.
Enhanced issue analytics
DETAILS: Tier: Ultimate Offering: GitLab.com, Self-managed, GitLab Dedicated
- Introduced in GitLab 16.3 with a flag named
issues_completed_analytics_feature_flag. Disabled by default.- Enabled on GitLab.com and self-managed in GitLab 16.8.
- Feature flag
issues_completed_analytics_feature_flagremoved in GitLab 16.10.
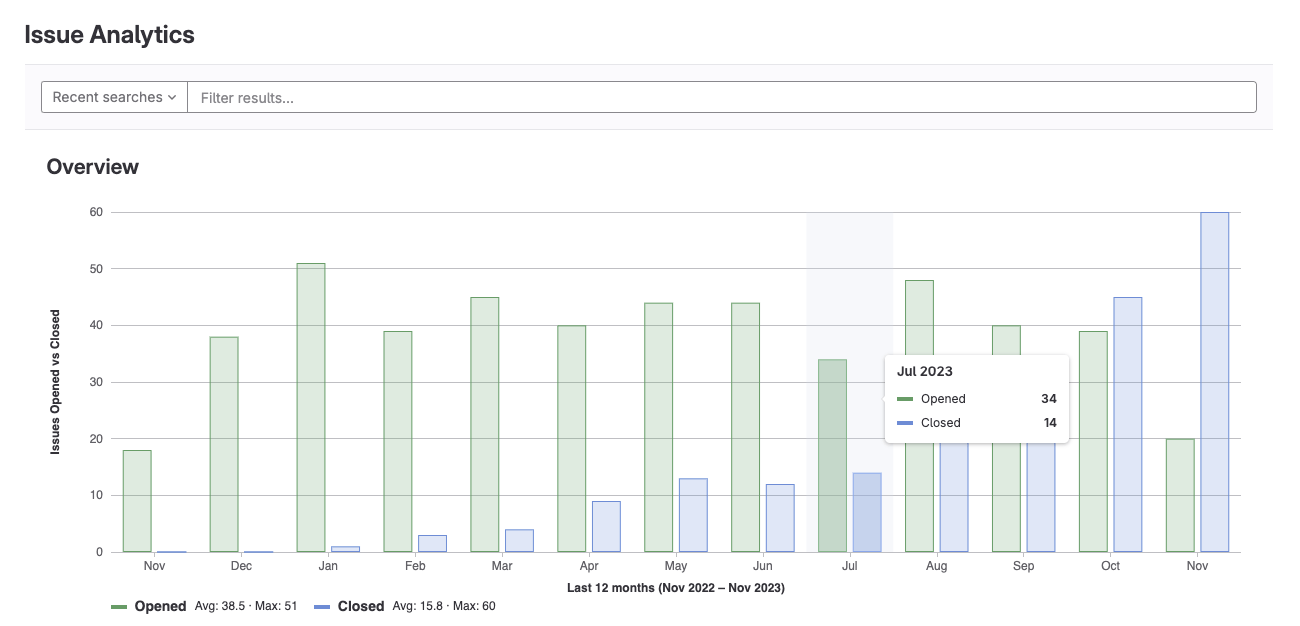
Enhanced issue analytics display the additional metric Issues closed, which represents the total number of resolved issues in your group over a selected period.
You can use this metric to improve the overall turn-around time and value delivered to your customers.
Drill into the information
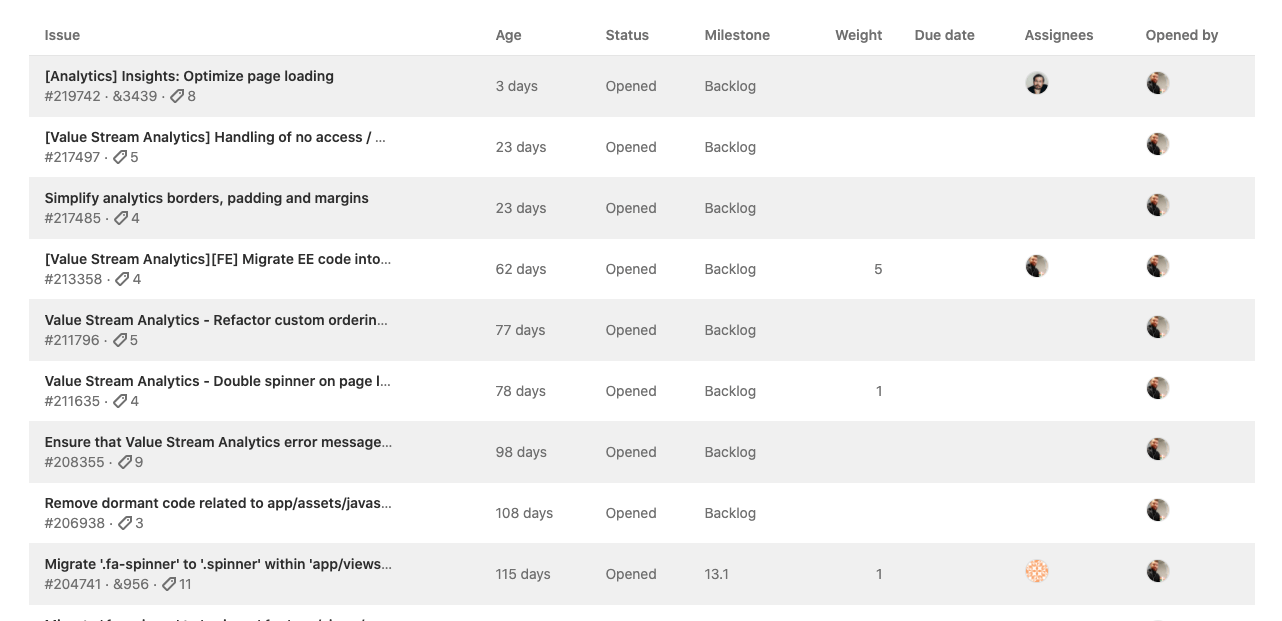
You can examine details of individual issues by browsing the table located below the chart.
The chart displays the top 100 issues based on the global page filters.


